
What Does a GraphQL / Server-State Client Cost You Per Request?
/ 9 min read
Every React Native app that talks to a server has to decide how it holds that
server state. You can reach for a full-fledged normalizing client —
Relay, TanStack Query,
RTK Query — or you can keep it
barebones with a plain fetch and Zustand /
Jotai / hand-rolled module state.
The features those big clients offer are real: normalized caches, automatic refetching and invalidation, structural sharing, query deduplication, observer graphs, optimistic updates. The question I wanted a number for is:
What do those features cost per network request in client-side CPU, and is that cost worth it on a low-end device?
So I built one app, six times over, and measured it. Everything here is reproducible — AndreiCalazans/GraphqlClientComparison.
The test harness
One Expo (SDK 57 / RN 0.86 / React 19, New Architecture) app that renders a
Coinbase-style markets screen against Coinbase’s public GraphQL API
(graphql.coinbase.com). It contains all six data layers behind one shared
DataLayer contract; the active one is chosen at cold start by a deep link
(gqlharness://home?variant=rtk). The UI is written only against that
contract, so it is byte-for-byte identical across variants — the only thing
that changes is the machinery behind the hooks. That’s what makes the delta the
library’s cost and not the UI’s.
What the app actually does (here’s the full T3 flow — sign in, balance, watchlist add/remove, live-ticking prices, asset detail with description / market cap / volume):
One binary, driven by Maestro. This run is the TanStack Query variant. The green profiler-done pill in the corner is the button the flow taps to stop the Hermes profiler — more on that below.
- Real data. Home renders five sections (Watchlist, Top gainers, Top losers,
Top movers, Recently listed), each four assets, via
searchAssetsV2+assetBySymbol. Asset detail pulls description, market cap, 24h volume + change, and multi-window price changes. Live prices stream from the Coinbase exchange WebSocket (ticker channel), coalesced to a 250 ms flush — the same transport for every variant. - Six variants, latest versions: Relay 21, TanStack Query 5.101, RTK 2.12
(RTK Query), Zustand 5.0, Jotai 2.20, and a vanilla baseline (module state
useSyncExternalStore, no library).
- Fair by construction. Every variant uses the same
fetch+ parsing and the same WebSocket. They differ only in how they cache, subscribe, and re-render around that data. - Device: a physical Samsung Galaxy A16 (SM-A165M) — a genuinely low-end phone, which is the whole point. Release build, Hermes.
- Maestro drives three e2e flows so runs are identical: T1 open → tap a top gainer → detail → back; T2 scroll to the bottom → open the last asset; T3 sign in → open a top loser → add to watchlist → back → reopen → unwatch → back (the long one, ~80 s, with the most live-price ticks).
How the JS-CPU numbers were captured
Two independent instruments:
- Flashlight for FPS, RAM, and
per-thread CPU (the
mqt_v_jsJS thread), median of 3 iterations per flow. - The Hermes sampling profiler, enabled in
MainApplication.onCreate(via an Expo config plugin) so it samples from the first bundle module load — early init and first render are in the trace, not just steady state.
One thing worth calling out because it changed the results: the profiler used to
stop on a fixed 20 s timeout, which truncated the ~80 s T3 flow and threw
away most of its samples — exactly the samples where the live-price ticks hit the
store. I replaced it with an on-screen stop button the Maestro flow taps at the
end of each test; the flow then asserts a profiler-done marker that only
appears after the .cpuprofile is written, so the host always pulls a complete
file. After that fix the measured library CPU roughly doubled and the T3
per-tick cost finally showed up. Measure the whole window, or don’t bother.
The bill: JS-thread CPU spent inside the library
The cleanest number is library self-time: source-map the Hermes trace, then
sum the time actually executing inside each library’s own node_modules (idle /
network wait excluded). Summed across all three flows:
| Variant | library self-time | vs vanilla | what runs |
|---|---|---|---|
| Vanilla JS | 0 ms | — | nothing — plain fetch + useSyncExternalStore |
| Jotai | 122 ms | +122 | atom read/write |
| Zustand | 277 ms | +277 | setState + selector notify |
| Relay | 804 ms | +804 | response normalization into the record store |
| TanStack Query | 904 ms | +904 | observer + structural sharing (replaceEqualDeep) |
| Redux Toolkit | 3218 ms | +3218 | Immer produce + reducer + reselect, per dispatch |
Two tiers fall out immediately:
- Barebones (Vanilla / Jotai / Zustand): essentially free. Jotai and Zustand give you real ergonomics for a few hundred milliseconds across the entire test suite — noise, in practice.
- Full server-state clients (Relay / TanStack / RTK): a real, measurable cost. Relay and TanStack are in the same ballpark (~0.8–0.9 s). RTK Query is 3–4× heavier than either, and ~26× the barebones stores.
The cost concentrates on writes — i.e. per request and per tick
Break the same self-time down by test and the shape of the cost appears. T3 is the longest flow and the one with the most live-price WebSocket ticks flowing through the store:
| Variant | T1 | T2 | T3 (auth + live ticks) |
|---|---|---|---|
| Vanilla JS | 0 | 0 | 0 |
| Jotai | 50 | 35 | 37 |
| Zustand | 72 | 36 | 169 |
| Relay | 202 | 120 | 482 |
| TanStack Query | 320 | 90 | 494 |
| Redux Toolkit | 697 | 587 | 1934 |
RTK’s cost explodes in T3, because its price updates go through the full Redux pipeline on every single tick. That’s the key insight about server-state clients: the cost is per cache write. A network response is a write. A live tick is a write. An optimistic update is a write. The more the library does to keep its cache correct and its observers consistent, the more each write costs — and if you route a high-frequency stream through it, you pay that toll continuously.
What that looks like on the JS thread
Here’s the actual Hermes flamegraph of the active JS work during T3 (idle / network wait removed) for RTK Query. Orange is Redux/Immer/reselect; blue-grey is React rendering:
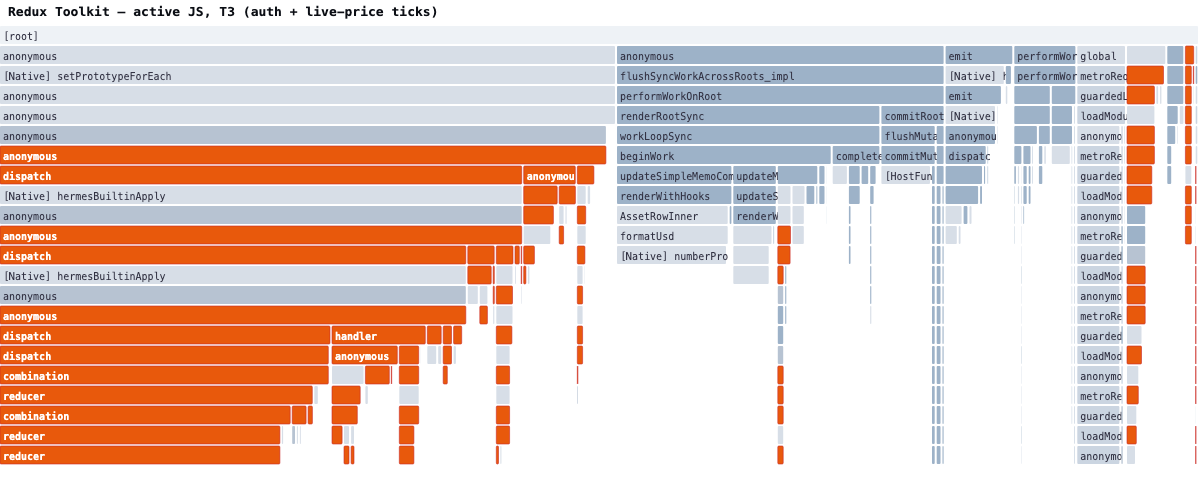
Look at the left third: stacks of dispatch → combination → reducer (Redux) and
Immer’s copy-on-write produce, repeating for each update, sitting right next to
React’s renderWithHooks / AssetRowInner. Every one of those orange towers is
a live-price tick being folded into the store.
Now the same flow, same device, Zustand:
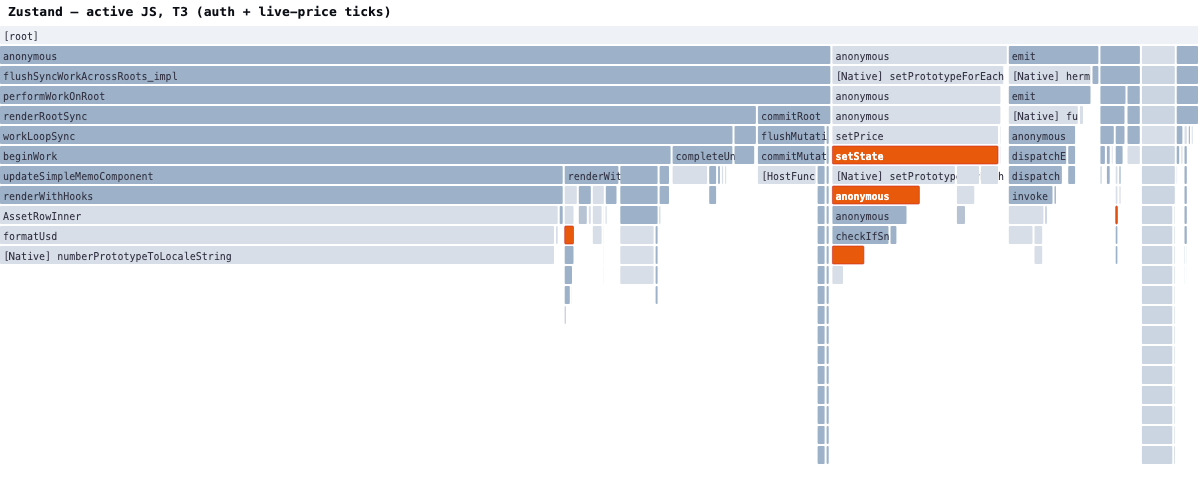
A live tick is a single setState — one thin orange sliver. The rest is React
doing the render it would have done anyway. That visual is the difference
between “server-state client” and “state primitive.”
FPS and RAM — and why “60 FPS” is a trap here
Across all six variants: ~60 FPS, and RAM within a ~7 MB band (254–261 MB). Frame rate did not separate the libraries at all.
Do not read that as “the data layer is free.” This harness is deliberately lightweight — its JS thread is mostly idle, waiting on the network. Even the heaviest client has plenty of headroom, so frames still land on time. In a real, busy app — many mounted screens, analytics, a deep component tree, feature providers, animations, and high-frequency data all sharing the single JS thread — that headroom is gone. There, the extra JS-CPU a heavy client burns on every write competes directly with rendering and gesture handling: the thread saturates,
requestAnimationFramecallbacks and touches queue up behind it, and the app feels janky and unresponsive — even though a micro-demo like this one still reports “60 FPS.” JS-CPU is the metric that predicts real-world responsiveness, precisely because it’s the resource that runs out first under load. FPS only looks flat here because nothing else is contending for the thread.
So what are you actually paying for?
The full-fledged clients aren’t expensive by accident — the cost is the feature. What you buy for that JS-CPU:
- Relay (~0.8 s): a normalized graph cache. Every asset is a single record
keyed by id; a price update to
BTCin one query updates it everywhereBTCis rendered, for free. You pay normalization on every response. If your app has the same entity on many screens and you want guaranteed consistency, this is the point of Relay — and its per-request cost is very reasonable for what it does. (Its ergonomics/compiler cost is a separate, build-time story.) - TanStack Query (~0.9 s): caching, dedup, background refetch, and
staleTime/gcTimelifecycle without prescribing a store shape. The recurring cost isstructuralSharing(replaceEqualDeep) diffing each response so unchanged references stay stable + observer notification. A great default when you want server-cache semantics but not normalization. - RTK Query (~3.2 s): the same query/cache features plus everything living
in one Redux store with Immer + reselect. That uniformity is genuinely valuable
if your whole app is already Redux — but the Immer-
produce-per-dispatch tax is the highest of the three, and it recurs on every write. On a low-end device, it’s the one to watch. - Zustand / Jotai (~0.1–0.3 s): not server-state clients at all — they’re state primitives. You get no cache lifecycle, no dedup, no normalization; you wire fetching yourself. In return you pay almost nothing per update.
Practical guidance
- Match the tool to the shape of your data, not to fashion. Same entity on many screens with strong consistency needs → Relay. Server-cache semantics without normalization → TanStack. Already all-in on Redux → RTK, eyes open. Simple screens / you’ll wire fetching yourself → Zustand or Jotai.
- Keep high-frequency data out of the heavy store. This is the big one. Live
prices, cursor positions, scroll offsets, anything ticking many times a second
— route those through a minimal
useSyncExternalStore-style channel, not through Immer/reselect (RTK) or deep structural sharing (TanStack). You can use a full client for the slow-moving, cacheable data and a thin store for the firehose. In this harness that single decision is the difference between 1934 ms and ~40 ms of library CPU in T3. - On low-end Android, a full server-state client is affordable if your write frequency is modest. A few requests per screen: fine. A stream of ticks folded into a normalizing/Immer cache: not fine.
Bottom line
The barebones stack (vanilla, Zustand, Jotai) is effectively free per request — but you build the caching, dedup, and invalidation yourself. Relay and TanStack Query charge a modest, mostly-per-write CPU fee for real server-cache features that are worth it when your data shape needs them. RTK Query gives you those features inside a uniform Redux world at 3–4× the per-write cost — the one to be deliberate about on a low-end device, especially if live data flows through it.
None of them will cost you frames in a demo. All of them will, in a busy app, if you route a firehose through them. Pick for the features you need, then keep the hot data out of the expensive path.
Full harness, all six variants, the Maestro flows, the Hermes profiles, the Flashlight JSON, and every raw number are in the repo: AndreiCalazans/GraphqlClientComparison.